


📊 Long-Term Rental Snapshot: Summer is coming to a close…
A Tougher leasing season is on the horizon!
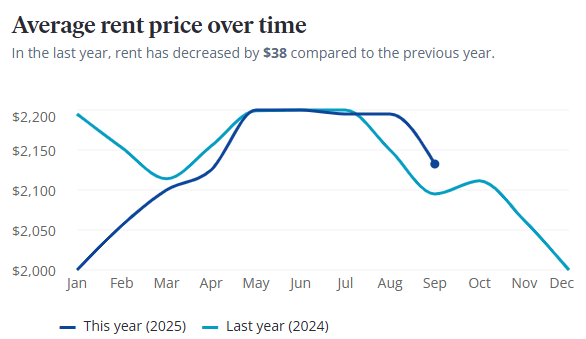
Is the Tampa rental market cooling? Get the latest data on $2,100 avg rents, STR performance, and why Tampa property supply is dropping by 22% this year.
Our company average over the last 30 days is 31 days on market for listing before we get an approved applicant nearly 15% faster than the national average for leasing currently. Factors that impact are the owner’s position on pricing, repair conditions and application qualifications that may be subpar for approvals.
(Data Last Updated in August) Per Zillow the average rental price across all property types in Tampa is $2,100 down from $2,200 two months ago, which is still 2% higher than the national average.
Depending on the price of your rentals you can observe the supply challenges for different price points. $1,400-2,400 seems to be the most competitive price ranges.
We encourage owners to consider a first month rent incentive of some sort, whether it is all or a portion of it FREE with a signed lease. Other incentives could include some sort of discounted security deposit as well.
Compared to last month, we’ve seen an increase in supply in the $1,400-1,800/mo. range but a decrease in supply in the $2,000-2,200/mo. range.

📊 Short-Term Rental Snapshot
Tampa’s STR market hit the bottom of its typical seasonal slump in September. Demand softened further, but performance metrics continue to look solid for operators who remain active. The story remains the same: shrinking supply is driving pricing stability, not increasing guest demand.
Last 7 Days:
ADR landed at $152 (↓$2), RevPAR held steady at $100 (↑$1), and bookings nudged up to 5,148 (↑9). However, active listings dropped from 6,264 to 5,763, a 8% weekly decline in available supply.
Last 30 Days:
Revenue reached $2.61M (↑$120K), ADR held at $158, and RevPAR ticked up to $94 (↑$2). Listings declined from 6,458 in August to 5,898 in September, a 8.7% monthly contraction.
Last 365 Days:
ADR settled at $156 (↑$1 YoY), RevPAR rose to $106 (↑$2), and active listings continued to fall, down from 7,626 to 5,898, marking a 22.6% annual supply reduction.
Why listings vary by time frame:
The7-day report reflects only those listings that were live and bookable during that specific week. In contrast, the30-day and 365-day reports include listings that may have been active part-time or sporadically during the period. This explains why ADR and RevPAR can appear healthy even when demand is declining. Fewer listings are competing for bookings.
Takeaway:
September represents the seasonal low point for STR demand in Tampa, historically the softest month of the year. Demand (booked nights) fell again, down 7.7% from August, and occupancy dropped to just 43%, the lowest level seen in the past quarter. Still, fewer competitors are capturing a larger slice of the market. As we turn the corner into October and high season approaches, expect occupancy and booked nights to begin climbing again. Operators who stayed in the game are well-positioned for the rebound.